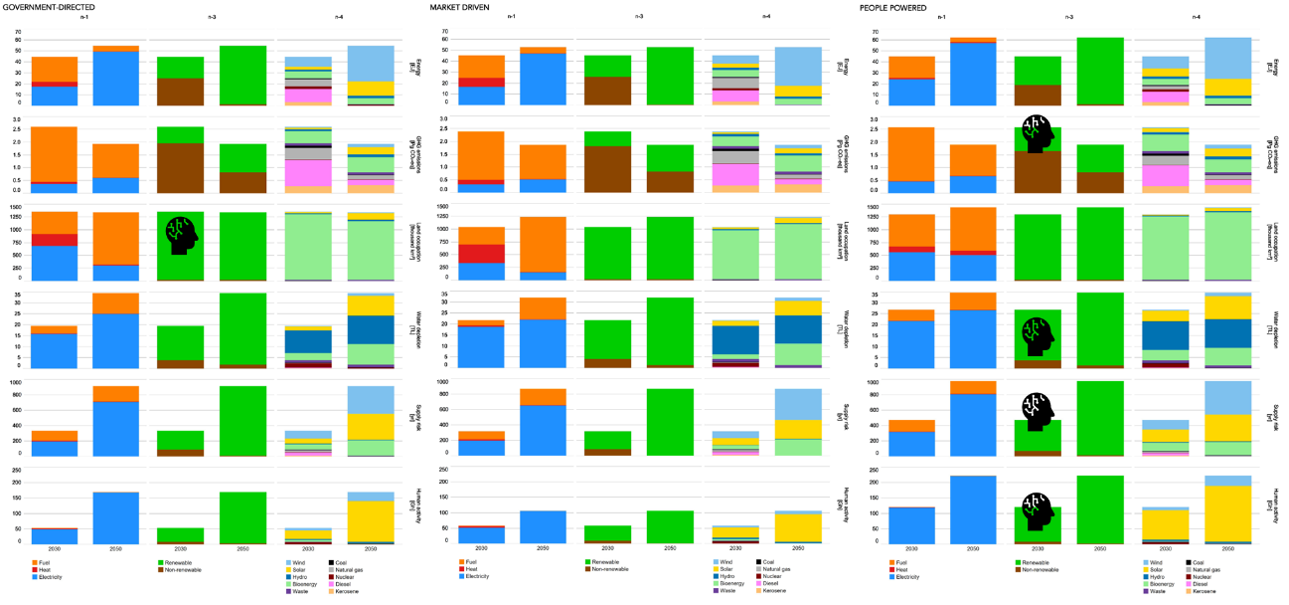
See how the people powered narrative has higher water depletion in the right chart? And see how this is due to higher amount of bioenergy?
We did this with the ENBIOS module, a python-based tool.
Watch a video explaining this here.
Models used
ENBIOS
environmental-impacts life-cycle-assessment multi-scale
Multi-Scale Integrated Sustainability Assessment module
DetailsSENTINEL case study
Case study: Continental – Europe
Europe-wide opportunities and trade-offs with particular reflection on the concerns, needs and demands of stakeholders.
Details